2nd Stage
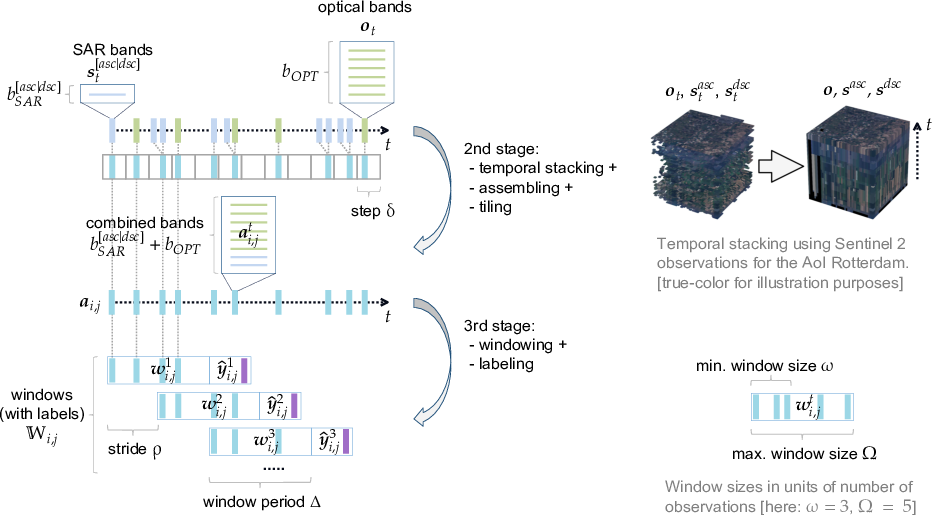
The workflow for the 2nd and 3rd stages with exposed parameters is illustrated below.

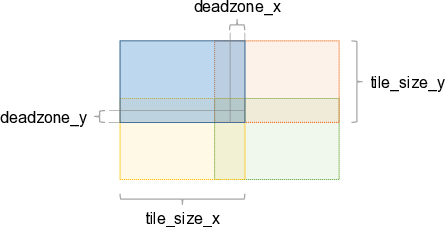
In case of overlapping tiles (deadzone_x > 0 and/or deadzone_y > 0), the image below shows the tile arrangement. The example only considers the neighboring tiles on the left/bottom of the blue tile. The same applies for neighboring tiles in the other directions.
Note: The overlap of tiles is always deadzone_[x|y] * 2 due to symmetries.

- class rsdtlib.Stack(sar_asc_path, sar_dsc_path, opt_path, sar_bands_name, sar_mask_name, opt_bands_name, opt_mask_name, tf_record_path, starttime, endtime, delta_step, tile_size_x, tile_size_y, bands_sar, bands_opt, deadzone_x=0, deadzone_y=0)
Class for stacking, assembling and tiling. The stacking is independent of each observation type. Assembling combines all observations over time, of types optical multispectral, and Synthetic Aperture Radar (SAR) in ascending and descending orbit directions.
Note: Even though the
starttimemight be later, earlier observations are still considered for stacking. That is, earlier observation pixels are carried forward if masked atstarttime. However, only observation time stamps are effectively written, that are within the time frame ofstarttimeandendtime.- Parameters:
sar_asc_path (str) – Directory of SAR observations (ascending)
sar_dsc_path (str) – Directory of SAR observations (descending)
opt_path (str) – Directory of optical multispectral observations
sar_bands_name (str) – Name of the SAR bands
sar_mask_name (str) – Name of the SAR mask
opt_bands_name (str) – Name of the optical multispectral bands
opt_mask_name (str) – Name of the optical multispectral mask
tf_record_path (str) – Tensorflow Record path to store results
starttime (datetime.datetime) – Starting time of the time series to consider
endtime (datetime.datetime) – End time of the time series to rconsider
delta_step (int) – The step value (\(\delta\)) to avoid redundant observations temporally close together
tile_size_x (int) – Tile size in
xdimensiontile_size_y (int) – Tile size in
ydimensionbands_sar (int) – Number of SAR bands for each orbit direction (\(b_{SAR}^{[asc\mid dsc]}\))
bands_opt (int) – Number of optical multispectral bands (\(b_{OPT}\))
deadzone_x (int) – Overlap tiles on x-axis so that neighboring tiles share
2*deadzone_xpixels per side (default =0)deadzone_y (int) – Overlap tiles on y-axis so that neighboring tiles share
2*deadzone_ypixels per side (default =0)
Example:
Define the stacking, assembling, and tiling with different parameters. Observations are taken from
sar_asc_path/sar_dsc_pathfor SAR data, andopt_pathfor optical multispectral data. The SAR and optical bands (“L1_GND” and “L1C_data”), and their masks (“dataMask” each) are explicitly specified. The timeframe to consider for stacking is 01-01-2017 till 01-07-2017. The step value \(\delta\) is set to two days, andyandxsizes of the tiles to 32 pixels each. The number of bands \(b_{SAR}^{[asc\mid dsc]}\) is two (for each oribt direction), and \(b_{OPT}\) is 13.import rsdtlib from datetime import datetime sar_asc_path = "<SOURCE PATH OF S1 ASC OBSERVATIONS>" sar_dsc_path = "<SOURCE PATH OF S1 DSC OBSERVATIONS>" opt_path = "<SOURCE PATH OF S2 OBSERVATIONS>" tf_record_path = "<DESTINATION PATH OF TFRECORD FILES>" stack = rsdtlib.Stack( sar_asc_path, sar_dsc_path, opt_path, "L1_GND", "dataMask", "L1C_data", "dataMask", tf_record_path, datetime(2017, 1, 1, 0, 0, 0), datetime(2017, 7, 1, 0, 0, 0), 60*60*24*2, # every two days 32, # tile size x 32, # tile size y 2, # bands SAR 13) # bands opt
- process()
Start the stacking, assembling and tiling process.
- Return type:
None
Example:
Start the stacking, assembling, and tiling process as defined by the object
stack. This will require significant compute resources depending on the amount of stacked observations.stack.process()